

Bumpy start to the quarter
Posted 5 April 2024
Following on from two very strong quarters for investors in risk assets, the start of the second quarter has seen a sudden change of mood, and the first distinct bout of equity volatility this year.
Indeed, on Thursday, the American leading stock market index, the S&P 500 had the largest one-day percentage range (high/low) in over a year. The last major hiccup was when the US regional bank SVB fell in March 2023. The banking problems back then elicited an infusion of liquidity from the US central bank, the Federal Reserve (Fed), which not only helped stabilise markets but actually fed the next stage of the rally.
This week’s bout of volatility will almost certainly not cause any policy response, given there is no comparable market surprise or shock. Rather, we suspect it is a consequence of the bull run which started last October, and the increasingly large dispersion of valuations for US equities and corporate bonds depending on whether they belong to large or small companies.
This does not make a snappy headline for fast moving capital markets journalists, so instead they blamed the usual suspects first. The events of Easter Monday in the Middle-East, meant a nervous start to our shortened week. It may be taking some time, but the Israel-Iran conflict does seem to be expanding rather than stabilising. The bombing of a diplomatic building adjacent to the Iranian embassy in Damascus might have been the spur for direct conflict. However, so far Iran responded only with a chilling promise of retribution rather than immediate revenge.
Nevertheless, oil traders were primed for a massive rise in oil prices but there was only a relatively small move over late Monday and Tuesday. However, in the afternoon session on Thursday and without any more big news, Brent crude oil prices broke above $90 per barrel while, at the same time, large cap US equities sold off, in particular the most highly valued (expensive) stocks.
The other plausible suspect for this week’s volatility is quarterly asset allocation moves by large investors. As the quarter closed last week, we mentioned how period ends can be dominated by the tidying up of investor portfolios – taking profits out of the winners and topping up the underperformers. The flip-side is that the start of a new period is when active investors are likely to institute new active positions. This week’s market moves suggest that a number of large investors are prepared to diversify away from the narrowing group of US mega-caps.
Investors may be confident of economic growth in the US, but so far have believed that the beneficiaries of strong expenditure are a few large companies. Investment in Artificial Intelligence (AI) research and equipment has benefited the likes of Nvidia and Microsoft, but not the world of small and mid-sized companies, who drove up their earnings by buying their chips and software to improve their productivity through investing in their application of AI. This view has been mirrored in analyst profit forecasts for each group, as the chart below illustrates.
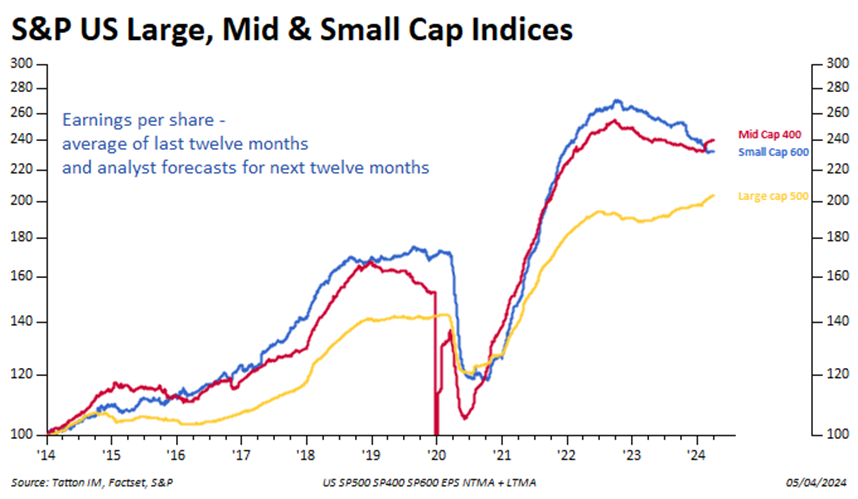
US companies form the bulk of global equity indices, so we’ll look at them specifically. The above chart shows the earnings expectations for large, mid and small sized companies as defined by S&P (the S&P 500, S&P 400 and S&P 600 respectively).
Despite the continued US growth, the two groups of non-large-cap have seen actual profits and profit expectations fall over the past year. This is quite unusual and suggests a different growth dynamic to the one we are used to. At the same time, it is a good reason for small and mid-cap company share prices to underperform relative to the large cap representing S&P 500. To be clear, this still does not mean that US small and mid-cap companies have cheap price-to-earnings valuations compared to normal. The small and mid-cap indices are priced around the 20-year averages, which are both about 15.5 times one year’s earnings. The S&P 500, by contrast, is trading at a price-to-earnings ratio of 21.8 times – against its 20-year average of 16.7 times.
If the S&P 500 were to move back to average valuation through an increase in earnings (rather than decline in share prices), it would have to see earnings rise by 30% for the index price to stand still. Relatively (on our measure), small and mid-cap earnings have fallen by about 11% since 2023 while the S&P 500 earnings have climbed about 8%, a relative change of slightly less than 20%. Moreover, large caps are still building in earnings growth outperformance despite having already done so.
Of course, large cap earnings outperformance has not just been about AI. There are many other factors, and the biggest is probably the financing environment. We have mentioned frequently that a regime of high short rates disproportionately affects smaller companies whose balance sheets and cash-flows are generally weaker than large caps. Until interest rates have actually begun to be cut, smaller companies will face a tough time.
Current growth is strong enough to give a bit of profit growth but also strong enough to keep unemployment down and wage demands up. That was particularly evident in March’s US employment report, where there was yet another big gain in US jobs. The pace of job growth is now above 2% annualised, having slowed in the autumn. Wage growth (at 4.1% annualised) is no longer accelerating but it is not falling back either. Therefore, consumer demand is highly likely to be well supported. A nominal growth rate of around 5% looks likely to stay in place.
Against this backdrop of healthy economic growth, we heard this week various Fed members downplay the likelihood of near-term rate cuts, and the data above tells us why. It remains encouraging for smaller companies that they continue to say that rate cuts are likely eventually, but interest rate traders and bond investors keep pushing the timing of the first cut further towards the second half of the year.
The Fed’s chair Jerome Powell spoke this week and said little about current monetary policy of note. He spent more time talking about the benefits of policy being independent of politics. This is clearly an issue where the Fed feels vulnerable. They may have to move rates while campaigning for this year’s presidential election has effectively begun and are desperate for this to be seen as non-partisan. Nevertheless, they are still in a difficult position regarding Treasury bond holdings. We have said it before, but it is remarkable that they continue to hold bonds while using a money market mechanism to soak up the excess liquidity that this has created. The imbalance of the financial system has resulted in an inverted yield curve (interest rates being higher than longer term bond yields) which has existed for longer than any other period – without it being accompanied by recession.
The Fed is understandably worried that rising longer bond yields might impact ailing commercial property portfolios of weak regional banks – and therefore bring about financial instability – but smaller companies are paying the price for those regional bank fragilities.
What does this mean for our view on this week’s market wobble? Given the very large and historically unusual valuation difference between the large and small cap segment of the market, there is a solid rationale for thinking small and mid-cap indices will outperform larger cap indices over the next two years. In a similar vein, the credit spread for smaller riskier companies – the difference between their borrowing rates and government bond yields – should go down when recession risks (and therefore the risk of defaults) decline – and over the past 6 months they already have done so. Mid and small-cap equities however, currently still have higher risk premia (investors demand higher returns for the same level of risk) than large caps, but this is only justifiable if people think the US economy will stay as top-heavy (growth or returns focused on big companies) as it has been. But since interest rates are expected to fall, stable and more balanced growth is entirely plausible.
However, the risk is that short-rates may still move higher, rather than lower. That could be extremely difficult for those companies and their share prices in the short term. If this week’s market moves are the consequence of taking that long-term view, those brave investors could be in for a rocky ride.